Continents
Discussion
Take some time to think about these questions and to discuss them with a friend.
|
Do you know what a continent is?
Which continent do you live in? Asia? South America? Africa?
Do you know which continent has the most people?
Have you ever visited another continent? Which countries did you visit within this continent?
The pie charts in the following exercises are about six continents. They give information about the population and wealth of the continents.
| |
Test your knowledge
A pie chart is sliced up like a pie into pieces. Each portion of the pie chart below represents a percentage. It's a good idea to look carefully to see what the ‘whole’ is, and then look at each ‘slice’ of the pie.
Use the information in the pie chart on the right to answer the questions below. Choose either TRUE (T) or FALSE (F) from the drop down menu.
|
|
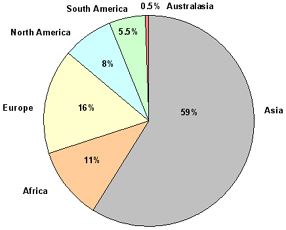
Continents by Population
|
Test your knowledge
Use the information in the pie chart on the right to answer the questions as true or false. Choose either TRUE (T) or FALSE (F) from the drop down menu.
|
|
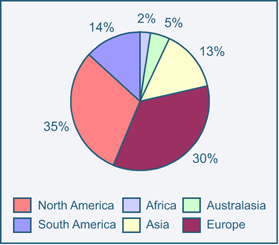
Continents by Wealth
|
Making comparisons
It’s important to be able to use comparisons when writing about the different percentages shown in a pie chart.
Fill in the gaps below with the adjective, comparative or superlative, and then insert the correct words in the sentences below.
|
|
Adjective |
Comparative |
Superlative |
|
wealthy |
wealthier |
|
|
large |
|
largest |
|
|
greater |
greatest |
|
few |
|
fewest |
-
- North America is the
![]() continent. continent.
|
|
|
Continents By Wealth
|
Introduction to the report
A good answer for Writing Task 1 needs a clear introduction of only one or two sentences. Often it is helpful to think of answering the questions – What? Where? When? After you've found the best opening sentence below, ask yourself – why is this the best one?
Choose the best phrase to complete a sentence for an introduction to a report on the pie chart on the right below.
|
| … has six continents and their population. |
| … shows the percentages of the total population of six continents – Asia, Africa, Europe, North America, South America and Australasia. |
| … gives us important information about Asia, Africa, Europe, North America, South America and Australasia. |
| … contains Asian, African, European, and other continents’ percentages. |
| … has a different colour for each continent; for example Asia is grey, Europe is yellow, Australasia is red, and so on. |
|
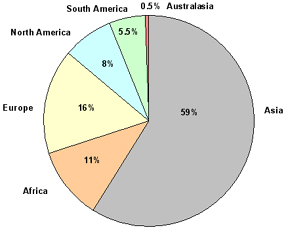
Continents By Population
|
The body of the report
The body of the report will have paragraphs corresponding to your main points. Where there are two pie charts you can write about one and then the other, as in the example below. This example has the introduction and then the body of the report.
Use the words below to fill in the blank spaces in the three paragraphs below.
|
followed by |
shows |
next largest |
less |
followed by |
shows |
|
The first pie chart ![]() the percentage of the world’s population in each of six continents – Asia, Europe, South America, Australasia and North America, and the second pie chart the percentage of the world’s population in each of six continents – Asia, Europe, South America, Australasia and North America, and the second pie chart ![]() the wealth of these continents in percentages. the wealth of these continents in percentages.
Asia has more than half of the population of all the continents together, at 59%, while Europe is the ![]() with 16%, with 16%, ![]() Africa (11%), North America (8%), South America (5.5%) and Australasia (0.5%). Africa (11%), North America (8%), South America (5.5%) and Australasia (0.5%).
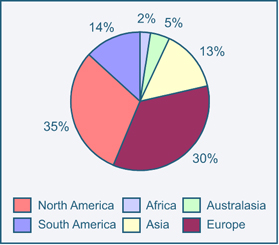
In terms of wealth, North America is the richest continent, with 35%, ![]() Europe with 30%. The other continents have much Europe with 30%. The other continents have much ![]() wealth, with South America having 14%, followed by Asia (13%), Australasia (5%) and Africa (2%). wealth, with South America having 14%, followed by Asia (13%), Australasia (5%) and Africa (2%). |
|
|

Continents By Population

Continents By Wealth
|
Conclusion
The report for Writing Task 1 should have a clear conclusion. This should be two or three sentences at the most, in which you conclude the report by pointing out the major trends that can be seen in the visual information.
Use the words or phrases below to complete the conclusion for this report.
|
while |
It can be seen |
a small percentage |
despite having |
tiny |
|
|

Continents By Population

Continents By Wealth
|
Writing a Task One report
You should spend about 20 minutes on this task.
The pie charts on the right give information about the ethnicity of students at a New Zealand primary school in 1980 and in 2005.
Summarise the information by selecting and reporting the main features, and make comparisons where relevant.
Write at least 150 words.
Write an answer for the IELTS Task One type question in the space provided. Then compare your report with our possible answer. Do you think this model answer has an adequate introduction, body and conclusion?
|
|
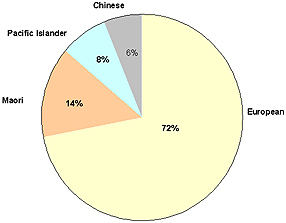
NZ School in 1980
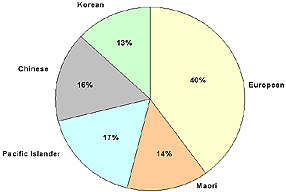
NZ School in 2005
|
|